This month marks the one-year anniversary of my “reboot” of The Hacker’s Diet and six months since I reached my target weight. My reasons for blogging about this very personal topic are described in an October 2012 post. In this post, I share my latest EatWatch charts and discuss my approach to weight maintenance.
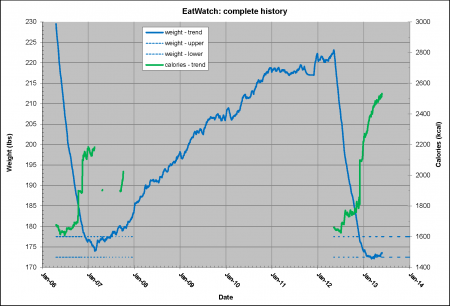
Figure 1 shows my weight and calorie tracking records from 20 Apr. 2006 to 25 May 2013. This “big picture” graph has value only for the context that it provides and to remind me of the road that I have traveled. We will examine portions of this graph in more detail in the following paragraphs.
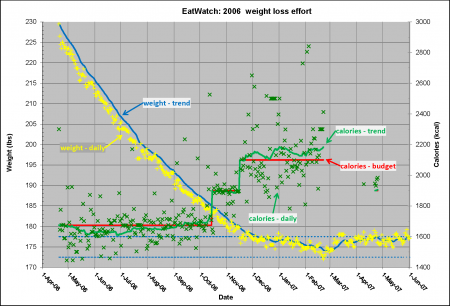
Figure 2 is a zoomed-in view of the left-hand portion of Figure 1. This figure illustrates a little more than one year of my 2006-2007 weight loss and maintenance experience. This is essentially the same figure shown in my October and December posts. It is repeated here for easy comparison with Figure 3.
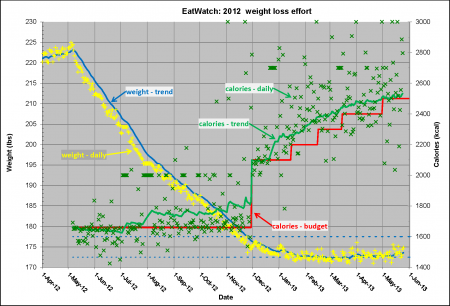
Figure 3 is a zoomed-in view of the right-hand portion of Figure 1. As previously reported, I began winding down my diet on 30 Nov. 2012. The goal was to stabilize my weight (solid blue line) in the 172.5-177.5 lb target zone by gradually increasing daily calorie intake (solid green line). In the following paragraphs we will compare my 2012-2013 approach with my 2006-2007 approach.
Figures 2 and 3 both show approximately 14 months of dieting and weight maintenance with The Hacker’s Diet. The first time around, I started the diet on 20 Apr 2006. I “rebooted” the diet on 6 May 2012. Consequently, one can do a month-by-month comparison of the dieting experiences. The red line in Figures 2 and 3 represents my calorie budget. The budget was approximately the same for most of the diet – 1675 kcal/day in 2006 and 1660 kcal/day in 2012. The main difference between these two experiences is how I managed the terminal phases of the diets. In 2006 I tried to execute a “soft landing” by increasing my calorie intake as I approached the target weight of 175 lbs. This worked OK, but it meant that the weight loss phase ran much longer. In 2012 I decided to maintain the low calorie budget longer so that I could complete the diet more quickly.
Another key difference between Figures 2 and 3 is that the calorie budget (red line) and calorie counts (green symbols and line) stop in late Feb 2007, but they keep going in 2013. After my failure the first time around, I became convinced that I needed to continue counting calories to firmly establish my steady-state metabolic rate and to train myself on maintaining a calorie intake consistent with my metabolic rate. The stair-step nature of the red calorie budget in Figure 3 shows how I have incrementally added calories to the budget to keep my weight from falling below 172.5 lbs. The calorie budget is currently at 2500 kcal/day.
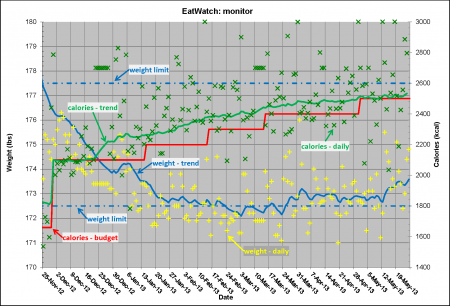
The Perfect Weight Forever chapter of John Walker’s book recommends establishing a 5 lb (i.e. +-2.5 lb) weight maintenance target zone with 10 lb (i.e. +-5 lb) hard limits centered on your target weight. My target weight is 175 lb, so my hard limit zone is 170-180 lb. Figure 4 shows my EatWatch data for the last 6 months plotted on a scale that matches these limits. This graph is very useful for monitoring my weight and calorie data against the established limits. You can see that my weight hovered around 172.5 lbs as I added calories to achieve weight stability. I will admit to just a little concern about the slight upward trend in recent days. If this persists, I may need to dial the calorie budget back just a bit from the present value of 2500 kcal/day. The good news is that I have the tools I need to closely monitor and control my weight. I am hopeful that I will eventually get to the point where daily calorie counting is not required; however, I am not in a big hurry to quit counting.


