The Hacker’s Diet – May 2013

This month marks the one-year anniversary of my “reboot” of The Hacker’s Diet and six months since I reached my target weight. My reasons for blogging about this very personal topic are described in an October 2012 post. In this post, I share my latest EatWatch charts and discuss my approach to weight maintenance.

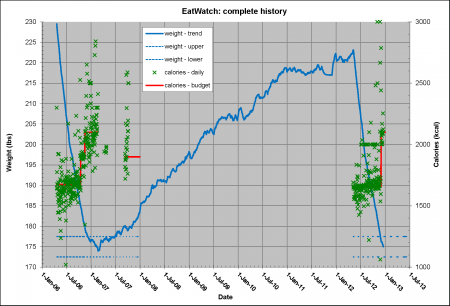
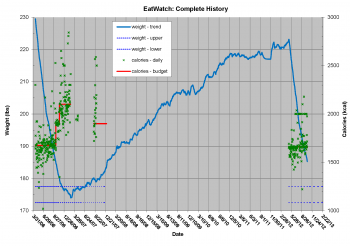
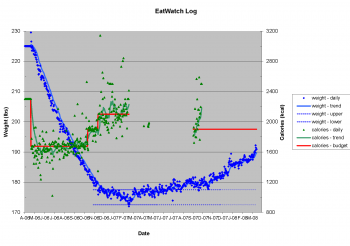
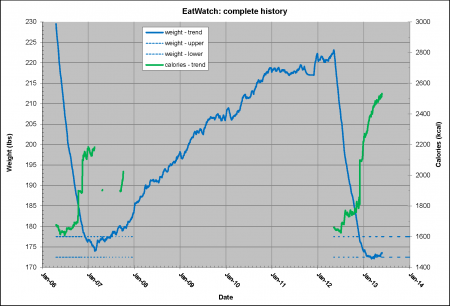
Figure 1 shows my weight and calorie tracking records from 20 Apr. 2006 to 25 May 2013. This “big picture” graph has value only for the context that it provides and to remind me of the road that I have traveled. We will examine portions of this graph in more detail in the following paragraphs.

20130525_EatWatch_all

Figure 1 – SAE EatWatch log to date [click on chart for a higher resolution version].

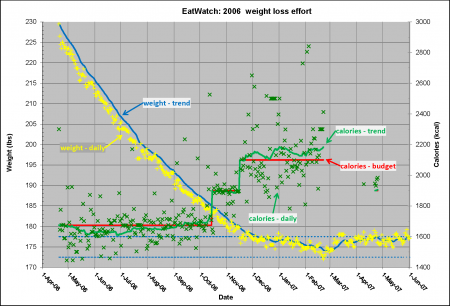
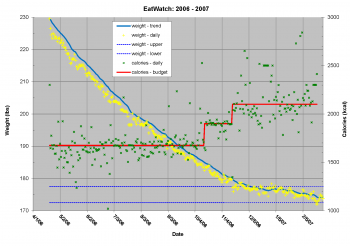
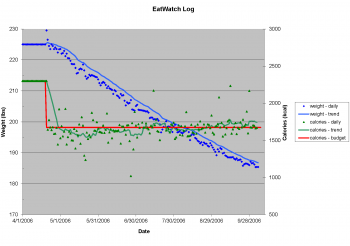
Figure 2 is a zoomed-in view of the left-hand portion of Figure 1. This figure illustrates a little more than one year of my 2006-2007 weight loss and maintenance experience. This is essentially the same figure shown in my October and December posts. It is repeated here for easy comparison with Figure 3.

20130525_EatWatch_2006

Figure 2 – SAE EatWatch log for 2006-2007 [click on chart for a higher resolution version].

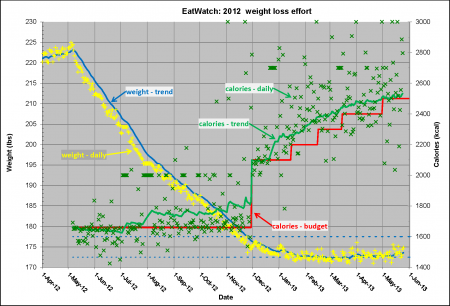
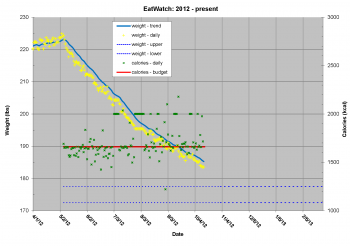
Figure 3 is a zoomed-in view of the right-hand portion of Figure 1. As previously reported, I began winding down my diet on 30 Nov. 2012. The goal was to stabilize my weight (solid blue line) in the 172.5-177.5 lb target zone by gradually increasing daily calorie intake (solid green line). In the following paragraphs we will compare my 2012-2013 approach with my 2006-2007 approach.

20130525_EatWatch_2012

Figure 3 – SAE EatWatch log for 2012-2013 [click on chart for a higher resolution version].

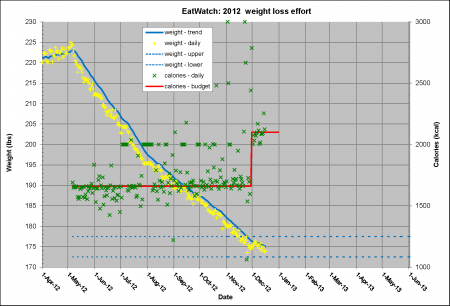
Figures 2 and 3 both show approximately 14 months of dieting and weight maintenance with The Hacker’s Diet. The first time around, I started the diet on 20 Apr 2006. I “rebooted” the diet on 6 May 2012. Consequently, one can do a month-by-month comparison of the dieting experiences. The red line in Figures 2 and 3 represents my calorie budget. The budget was approximately the same for most of the diet – 1675 kcal/day in 2006 and 1660 kcal/day in 2012. The main difference between these two experiences is how I managed the terminal phases of the diets. In 2006 I tried to execute a “soft landing” by increasing my calorie intake as I approached the target weight of 175 lbs. This worked OK, but it meant that the weight loss phase ran much longer. In 2012 I decided to maintain the low calorie budget longer so that I could complete the diet more quickly.

Another key difference between Figures 2 and 3 is that the calorie budget (red line) and calorie counts (green symbols and line) stop in late Feb 2007, but they keep going in 2013. After my failure the first time around, I became convinced that I needed to continue counting calories to firmly establish my steady-state metabolic rate and to train myself on maintaining a calorie intake consistent with my metabolic rate. The stair-step nature of the red calorie budget in Figure 3 shows how I have incrementally added calories to the budget to keep my weight from falling below 172.5 lbs. The calorie budget is currently at 2500 kcal/day.

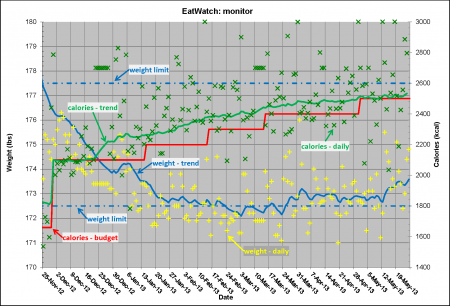
The Perfect Weight Forever chapter of John Walker’s book recommends establishing a 5 lb (i.e. +-2.5 lb) weight maintenance target zone with 10 lb (i.e. +-5 lb) hard limits centered on your target weight. My target weight is 175 lb, so my hard limit zone is 170-180 lb. Figure 4 shows my EatWatch data for the last 6 months plotted on a scale that matches these limits. This graph is very useful for monitoring my weight and calorie data against the established limits. You can see that my weight hovered around 172.5 lbs as I added calories to achieve weight stability. I will admit to just a little concern about the slight upward trend in recent days. If this persists, I may need to dial the calorie budget back just a bit from the present value of 2500 kcal/day. The good news is that I have the tools I need to closely monitor and control my weight. I am hopeful that I will eventually get to the point where daily calorie counting is not required; however, I am not in a big hurry to quit counting.

20130525_EatWatch_monitor

Figure 4 – SAE EatWatch monitoring graph [click on chart for a higher resolution version].

The Hacker’s Diet – Update

I recently reached my target weight and have moved into the maintenance phase of The Hacker’s Diet. In this post, I share my current EatWatch charts along with some very brief descriptions.  See my October post for a more detailed discussion of these charts.

Figure 1 shows my weight and calorie tracking records from 20 Apr. 2006 to 16 Dec 2012.  As you can see the filtered weight values are now (finally!) back in the target zone.

20121216_EatWatch_all

Figure 1 – SAE EatWatch log to date [click on chart for a higher resolution version].

Figure 2 is a zoomed-in view of the left-hand portion of Figure 1. This figure illustrates a little more than one year of my 2006 weight loss and maintenance experience.  This is essentially the same figure shown in my October post. It is repeated here for easy comparison with Figure 3.

20121216_EatWatch_2006

Figure 2 – SAE EatWatch log for 2006 [click on chart for a higher resolution version].

Figure 3 is a zoomed-in view of the right-hand portion of Figure 1.  I ended my diet on 30 Nov. 2012 – my 49th birthday as it turns out.  You can see that I increased my calorie budget from 1,660 kcal/day to 2,100 kcal/day.  My plan is to maintain 2,100 kcal/day for at least a month until I determine the steady-state metabolic rate for my current weight.  Figure 2 shows that I followed a similar transition approach in 2006; however, then I wound down the diet by increasing my calorie budget in two steps.  This led to a longer overall transition period.  So far, the 2012 approach seems to be working better for me.

20121216_EatWatch_2012

Figure 3 – SAE EatWatch log for 2012 [click on chart for a higher resolution version].

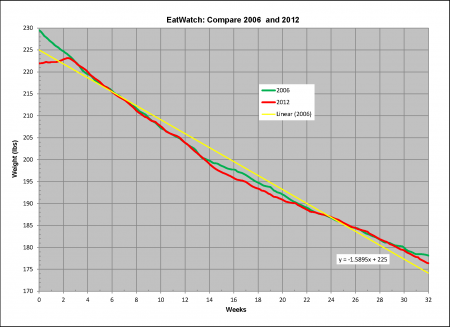
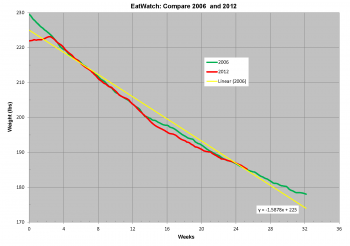
Figure 4 compares my 2006 and 2012 weight loss experiences. This chart covers 32 weeks. The 2012 diet had a slightly lower initial weight than the 2006 diet, so the curve has been shifted to the right by a little more than 2 weeks to enable direct comparison. The linear curve fit of the 2006 data shows an average loss rate of almost 1.6 lbs/wk. More detailed analysis shows that my weight loss rate started off at about 2 lbs/wk and tapered off to a little more than 1 lbs/wk during the latter portion of the diet.  The knee or breakpoint in the curve occurred at about 200 lbs in both 2006 and 2012.  As noted in my October post, I find it remarkable how closely the two curves track each other.

20121216_EatWatch_compare

Figure 4 – SAE EatWatch log comparison between 2006 and 2012 [click on chart for a higher resolution version].

The Hacker’s Diet – 2012

This post addresses the very personal topic of dieting and weight management.  I venture into this sensitive subject for a couple of reasons.  Firstly, because I have benefited from the weight management experiences shared online by others it seems only right to “put myself out there” in the hope of helping others.  My second reason is more selfish.  I am posting this, in part, to hold myself accountable.  I speculate that I may do a better job of weight management if I have to periodically publish updates.

A couple of previous posts describe my experience with The Hacker’s Diet by John Walker.  My 2006 post explains why this method appeals to me and describes how I applied it to my situation.  In my 2011 post I share some additional thoughts on the system and briefly discuss my failure in the maintenance phase. About five months ago I started using the diet again. This post describes my recent experience and compares it with my previous experience.

EatWatch log visualization and discussion

A central concept in The Hacker’s Diet is a fanciful EatWatch device that tells you when to eat and when to stop eating in order to maintain your desired weight.. The book describes the underlying principles of the EatWatch and provides you with the tools to “build” one for yourself. This section presents data from my EatWatch.

The chart shown in Figure 1 presents my entire EatWatch history – April 2006 until the present. As you can see, I am a dedicated researcher who felt compelled to repeat my 2006 weight loss experiment to verify the findings 🙂  Seriously,  I am still trying to understand what went wrong after my initial success.  I may examine that topic in another blog entry. This post simply presents the facts as recorded by my EatWatch.

The horizontal axis in Figure 1 is time from April 2006 through the present.  The left vertical axis is weight in lbs, and the right vertical axis is dietary calories (i.e. kilogram calories) in kcal.  The blue curve in Figure 1 is the smoothed weight values.  The red line represents my calorie budget during diet periods.  The green data points are daily calorie counts. The dashed blue lines in Figure 1 depict the target weight range (a 5 lb band centered on 175 lbs) that I intended to maintain.

20121014_EatWatch_all

Figure 1 – SAE EatWatch log to date [click on chart for a higher resolution version].

My 2006 and 2012 diets are clearly indicated by the steep negative slope sections of the blue smoothed weight curve along with the green calorie count data points.  You will note a third region of calorie count data points in September 2007 where I briefly attempted to reapply the diet as my weight deviated from the target band.

Perhaps the most notable feature of Figure 1 is the extended period of steady weight gain from early 2007 through the end of 2010. This graphically illustrates my total failure to implement the weight maintenance principles described in the Perfect Weight Forever chapter of John Walker’s book. Analysis shows that I gained about 0.22 lbs/week during this period. That rate of weight gain equates to a surplus of 110 calories per day. To put that in perspective, that is an extra cookie OR banana OR 8oz glass of orange juice per day. The rate of weight gain tapers off for the last year or so to about 0.06 lbs/week or 30 extra calories per day.

The chart shown in Figure 2 is an updated version of the EatWatch log presented in my 2006 post.  Think of Figure 2 as “zooming in” on the left portion of Figure 1 with some additional data plotted. The yellow symbols are daily weight measurements. The blue line is the smoothed weight. The red line is my calorie budget. The green symbols represent daily calorie counts.

20121008_EatWatch_2006

Figure 2 – SAE EatWatch log for 2006 [click on chart for a higher resolution version].

Adding the daily weight values (yellow symbols) to the chart illustrates the value of the smoothed weight curve.  As described in the Signal and Noise chapter of John’s book, filtering or smoothing the daily readings from the bathroom scale is just about the only way to stay sane while dieting.  My 2006 experience with The Hacker’s Diet was perfectly satisfactory.  The EatWatch tools worked exactly as advertised, and the diet was tolerable.

The chart shown in Figure 3 is my EatWatch log for 2012. Think of Figure 3 as “zooming in” on the extreme right portion of Figure 1 with some additional data plotted. As before, the yellow symbols are daily weight measurements. The blue line is the smoothed weight. The red line is my calorie budget. The green symbols represent daily calorie counts. You can see that the 2012 EatWatch history appears to be quite similar to my 2006 experience. We will examine that further in the next figure.

20121014_EatWatch_2012

Figure 3 – SAE EatWatch log for 2012 [click on chart for a higher resolution version].

The chart shown in Figure 4 compares my 2006 and 2012 experiences.  Weight is shown on the vertical axis while the horizontal axis depicts time in elapsed weeks.  The green curve chats the smoothed weight values from my 2006 experiment, and the red curve shows 2012 smoothed weight values.  These two weight loss experiments had slightly different starting weights (229.5 lbs and 223.1 lbs respectively), so the red curve has been shifted to the right by 16 days to enable direct comparison between the curves.  In other words, the 2012 diet started 16 days later than the 2006 diet.

I was pleasantly surprised and oddly reassured by the incredibly close correspondence between the 2006 and 2012 curves.  I was completely confident that The Hacker’s Diet would work as it had before, but I never expected that the weight loss histories would agree so closely.

20121014_EatWatch_compare

Figure 4 – SAE EatWatch log comparison between 2006 and 2012 [click on chart for a higher resolution version].

The yellow line in Figure 4 is a linear trend line (simple linear regression) fit to the 2006 smoothed weight data. The equation for this trend line is shown near the bottom of the figure. The slope (i.e. rate of weight loss) is approximately -1.6 lbs/wk. Comparing the smoothed weight curves with the linear trend line you can see my rate of weight loss was higher at the beginning of the diet than at the end. The knee of the curve (i.e. point where the slope changes) occurs right around 200 lbs for both the 2006 and 2012 data sets. I believe this change in the rate of weight loss can be explained by the fact that your metabolic rate is a function of your weight – the heavier you are the more calories you need to maintain a constant weight. Yes, it is a sad irony that the process of losing weight makes it harder to keep losing weight!

Differences between 2006 and 2012

As indicated by Figure 4, my 2012 experience is very similar to my 2006 experience.  There are, however, a few differences this time around.  The primary difference is that technology has provided me with better tools that make calorie counting noticeably easier.  In 2006, I used a Palm PDA application to keep track of my calories.  The Palm app “remembered” my previous entries, but it did not come with a pre-populated database.  I had to use external references to estimate calories for various foods.  I did this with an FDA database Palm app and numerous nutrition information PDF documents for restaurants that I frequented.  This method worked surprisingly well, but it was pretty labor intensive.

The 2012 version of my EatWatch uses an Android smartphone instead of the Palm PDA. Rather than relying on the static databases and PDF references I carried on my PDA, the smartphone can readily access all of the nutrition information available on the Internet. Calorie checks can be accomplished via standard web searches or one can use a calorie counting app with associated databases and a search function. Even better, the apps also feature the ability to scan product UPC symbols (i.e. bar codes) for incredibly convenient calorie check and data entry.

The Hacker’s Diet – 2011

NOTE: This post originated as a 14 Feb 2011 email that I sent to the men in my church cell group (i.e. Bible study group). I have adjusted the date on this blog post to match the original email and made some minor edits. One of the guys in my cell group was highly motivated to lose a significant amount of weight over a short time period. He requested prayers and advice. That request prompted me to share my weight loss experience even though I was obviously failing at the time. Looking back, I find it interesting that I only shared the first two years of my EatWatch history with the guys. I think I was simply too embarrassed by my lack of dietary discipline to share the whole data set.

Guys:
Yesterday we discussed weight loss strategies. The one that worked for me (despite current evidence to the contrary 🙂 ) is called The Hacker’s Diet. See below for some notes I prepared a few years ago. As you read the following please keep in mind that this is what worked FOR ME. I am not pitching this as a universal solution – just sharing what worked FOR ME.

NOTE: I lost 35 lbs in the first 22 weeks of this diet, so this seems applicable to the weight loss objectives we discussed yesterday.

keys to The Hacker’s Diet

  • calorie counting (yucky, but not as hard as I expected)
  • daily weight tracking (uses exponentially smoothed moving average to show “true” weight)
  • simplicity (a calorie, is a calorie, is a calorie and 3,500 calories = 1 lb )

tools and sample data

The attached spreadsheet has the formulas and about two years of my data for an example. The blue data points are in the chart (below) are the daily weights which vary quite a bit. The solid blue line is the exponentially smoothed moving average. The solid red lines are the calorie targets and the green data points are my estimates of calorie intake. You can see that I increased my calorie budget as I approached my weight loss target. This was to reward myself and execute a “soft landing” at the target.

20110214_EatWatch

SAE EatWatch log through spring 2008 [click on chart for a higher resolution version].

What went wrong for Shawn???

I began the Hacker’s diet in April 2006 and quit actively counting calories in early 2007. You can see from the chart that I lost pretty close to 50 lbs during that period. I continue to track my weight daily. Over the ensuing 4 years I have gained most of that back. What went wrong? My data shows that I have consistently gained 0.22 lbs/week over the last for 4 years. That’s about 110 calories/day – equivalent to a can of soda per day. Basically, I got lazy and undisciplined and have not countered this gradual weight creep. If only… If only… Sigh… The good news (if there is any) is that I have a weight loss tool that is absolutely proven to work (FOR ME). I just need to muster the discipline to use it again.

but counting calories is such a pain

Indeed it is, but not as bad as I had imagined. I am really pretty consistent in what I eat. I simply had to figure out the calories for items I regularly eat and then tabulate these as I went. I found a smartphone calorie counter app helped with the tabulation. Also, most restaurants now publish complete nutritional info (examples attached) and the USDA has some good resources.

This 2011 email concluded with a forward of my 2006 email on weight loss.

The Hacker’s Diet – 2006

NOTE: This post originated as a 22 Sep 2006 email that I sent to a few friends who requested information on my approach to weight loss.  I have adjusted the date on this blog post to match the original email date and made some minor edits.

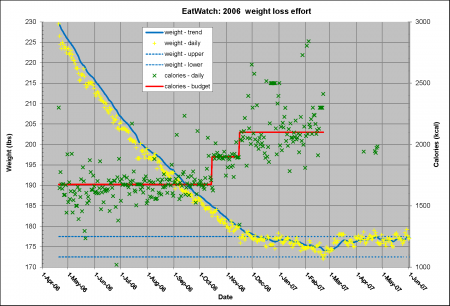
The figure shown below is my “EatWatch” log from this timeframe which was shared with many of the email recipients.  The blue data points are daily weight measurements.  The blue line is the smoothed or filtered weight value.  The red line is my calorie budget.  The green data points are my daily calorie intake and the green line is a smoothed or filtered calorie value.

20061005_EatWatch

SAE EatWatch log from fall 2006 [click on chart for a higher resolution version].

Folks,
You have expressed an interest in my approach to weight loss. I really don’t like it when people proselytize on this very personal subject, and I don’t want to appear to do that myself. However, since you asked I will tell you a little about the method I’m following.

The Hacker’s Diet

The approach to weight loss presented in this book really resonated with me. The author, John Walker, has made it freely available (HTML for online use and Adobe PDF for download) on his website.

Following are some aspects of his approach that are important to me:

simple logical engineering treatment of the subject

His explanation of the weight control problem really made sense to me. He reduces the human food processing system to a simple model and demystifies the whole complex field of nutrition. Basically, he uses physics (which I like and understand) instead of chemistry (which has always confused me) to tackle weight loss and control. In John’s simple model all calories are equal and 3500 calories equals one pound of fat. If you want to lose a pound per week than you need to eat 500 fewer calories per day than you burn.
(3500 cal/wk) / (7 day/wk) = 500 cal/day

use of moving averages to process daily weight measurements

Feedback from daily weight measurements is a very important part of this method; however, daily weight measurements have HUGE variability. John explains the cause of this variability and introduces a method based on moving averages to pull useful information from this noisy data.

realization that exercise alone is very unlikely to result in weight loss

I NEVER thought I would count calories. My plan was always to “eat sensibly” and exercise a bit more. John strongly encourages exercise but he convincingly demonstrates that it is unrealistic to rely on exercise alone for weight loss. I am now convinced that counting calories is the only realistic way for ME to lose weight.

realization that dieting isn’t forever

This is so idiot simple that I’m almost embarrassed to mention it. However, John’s simplified method enabled me to realize that the diet didn’t have to go on forever. You run the calorie deficit to reach your weight loss goal, but once there you can add those calories back to your diet. In fact, you must add them back to stabilize at your target weight. The key is to continuously monitor your weight and caloric intake to maintain your target, but you don’t have to keep starving yourself.

my experience to date

I started this project on April 20 planning to lose 1.25 lbs/wk. This required a daily deficit of 625 cal. Using various formulas I estimated that I was burning about 2300 cal/day. This gave me a daily calorie budget of 1675 cal.
1.25 lbs/wk * 3500 cal/lb = 4375 cal/wk
(4375 cal /wk) / (7 day/wk) = 625 cal/day
2300 cal/day – 625 cal/day = 1675 cal/day

I’ve been on the diet for 22 weeks now and have lost a little more than 35 lbs. This translates into about 1.6 lbs/wk which is a bit higher rate than I was targeting. I was intentionally conservative in estimating my daily burn rate (i.e. 2300 cal/day) and I try to stay a bit under the 1675 cal/day budget. I have not adjusted the budget because I’m very happy with the higher burn rate.

I have not significantly changed my diet. I just eat smaller portions to stay within my budget. I choose not to eat some high calorie foods (e.g. french fries) because I prefer to save those calories for stuff I really want. I routinely eat pizza, ice cream and fast food. Just not as much as before and I am much more selective about my menu choices.

Measuring portions is key for me. I measure my cereal in the morning. I make sure I know the volume of my OJ glass. I count out chips, peanuts, grapes, etc. You gotta know how much you ate to keep track of the calories, and I was completely amazed to realize just how much I was eating before.

1.6 lbs/wk equates to a daily calorie deficit of 800 cal. I have found this pretty manageable. I get frustrated and a little cranky when I have to cut myself off when others (e.g. my kids) are still chowing down; however, I don’t feel that I am starving and I haven’t experienced major cravings or urges.

If I do blow the budget on a given day, I don’t sweat it too much. You simply can’t eat enough in a single day to wreck your diet. All it will do is slow down your rate of loss a bit. Just get back on track the next day and keep moving forward.

I’ve found that counting calories isn’t very hard. This is particularly true because I tend to eat the same or similar meals from week to week. Once you figure out how many calories are in a particular item you can reuse that information. I believe that counting calories and measuring portions is key at least for the first few months. John claims that one eventually develops a really refined ability to estimate calories. I’m not there yet.

The Tools I Use

John Walker’s EatWatch software

This is a weight log with exponentially smoothed moving average filters to help you extract useful data from the very noisy daily weight measurements. I have found this trend information very helpful during the times when the daily measurements were not going my way. I expect the tool to be even more useful when I get to the weight maintenance phase. This tool is available as a Palm app and as MS Excel spreadsheets.

calorie/nutrition references

These are essential. John’s book has a pretty extensive calorie table. I also use a freely-available Palm nutrition reference from the USDA. Finally, I have found nutrition data online for most fast food restaurants and carry these PDF files with me. That is a big help when the family goes out for fast food.

calorie counting software

I use a little Palm freeware app called Fitness Record to count calories. It provides you with a running total for the day and if you enter you budget or target it will show you how many calories you can still eat. The coolest thing about this app is that it remembers your entries for the last 90 days. So if you had a Whopper Jr. a few weeks ago it will pop that info up when you start typing “whop”. Makes counting calories pretty painless.

Hope some of this proves useful for you. No more preaching – I promise!
Shawn