I recently reached my target weight and have moved into the maintenance phase of The Hacker’s Diet. In this post, I share my current EatWatch charts along with some very brief descriptions. See my October post for a more detailed discussion of these charts.
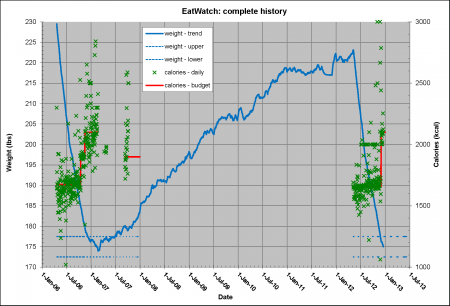
Figure 1 shows my weight and calorie tracking records from 20 Apr. 2006 to 16 Dec 2012. As you can see the filtered weight values are now (finally!) back in the target zone.
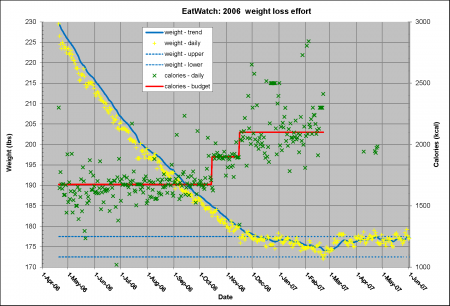
Figure 2 is a zoomed-in view of the left-hand portion of Figure 1. This figure illustrates a little more than one year of my 2006 weight loss and maintenance experience. This is essentially the same figure shown in my October post. It is repeated here for easy comparison with Figure 3.
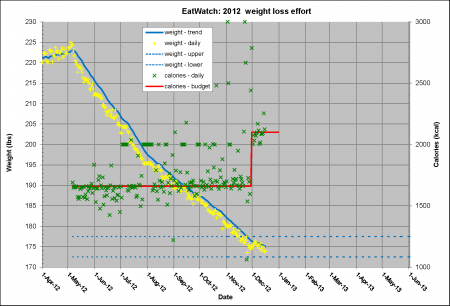
Figure 3 is a zoomed-in view of the right-hand portion of Figure 1. I ended my diet on 30 Nov. 2012 – my 49th birthday as it turns out. You can see that I increased my calorie budget from 1,660 kcal/day to 2,100 kcal/day. My plan is to maintain 2,100 kcal/day for at least a month until I determine the steady-state metabolic rate for my current weight. Figure 2 shows that I followed a similar transition approach in 2006; however, then I wound down the diet by increasing my calorie budget in two steps. This led to a longer overall transition period. So far, the 2012 approach seems to be working better for me.
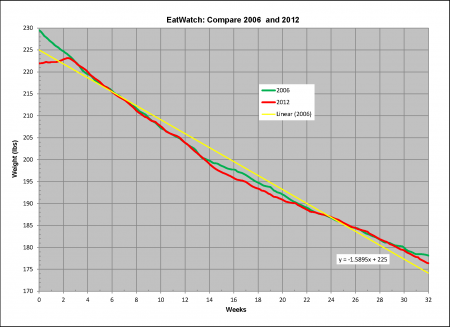
Figure 4 compares my 2006 and 2012 weight loss experiences. This chart covers 32 weeks. The 2012 diet had a slightly lower initial weight than the 2006 diet, so the curve has been shifted to the right by a little more than 2 weeks to enable direct comparison. The linear curve fit of the 2006 data shows an average loss rate of almost 1.6 lbs/wk. More detailed analysis shows that my weight loss rate started off at about 2 lbs/wk and tapered off to a little more than 1 lbs/wk during the latter portion of the diet. The knee or breakpoint in the curve occurred at about 200 lbs in both 2006 and 2012. As noted in my October post, I find it remarkable how closely the two curves track each other.


